
bioprocess monitoring
Bioprocess Monitoring: How Batch, Fed-Batch, and Continuous Processes Shape Real-Time Analytics
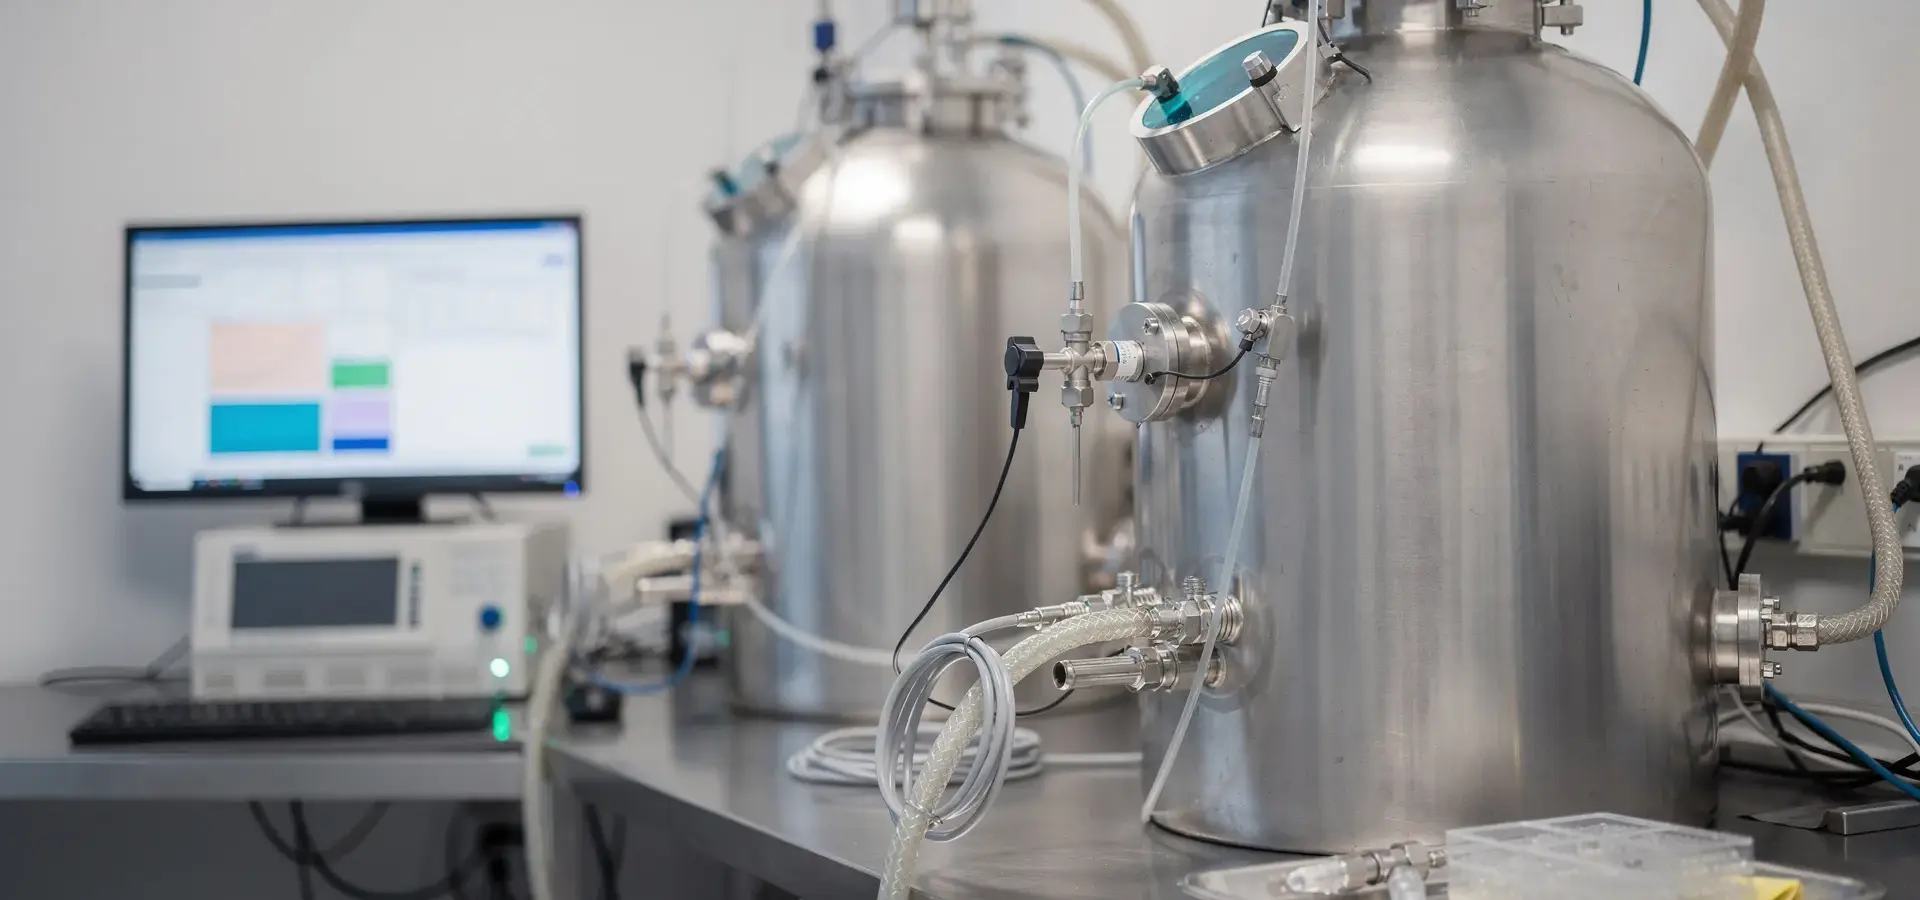
See the bioprocess as a connected production sequence
Bioprocesses use controlled biological systems to convert feedstocks into products, with upstream preparation and growth followed by downstream recovery or purification. A bioreactor, sometimes called a fermenter, provides the controlled setting where a specific biological process takes place.
The production sequence usually extends beyond the vessel. Upstream processing can include:
- Preparing and sterilizing the medium
- Growing the inoculum
- Sterilizing equipment
- Running growth or production in the main bioreactor
Downstream processing begins after cell harvest and can include dewatering, extraction, purification, equipment sterilization, and wastewater effluent treatment. A measurement question at the bioreactor may therefore relate to a later recovery or quality question.
A monitoring plan should follow material through this connected sequence rather than treating the bioreactor as an isolated unit. You may need visibility into the feed, culture, product, biomass, or downstream stream, depending on the process question.
Start by naming three things: the stage where a change matters, the material that changes, and the decision that depends on seeing it. That sequence gives you a more useful starting point than choosing an analytical technique before defining the process question.
Trace how batch, fed-batch, and continuous operation move material
Process mode determines how nutrients, cells, products, and by-products move through the vessel. That movement shapes which changes you may need to observe and how quickly the information must arrive.
| Process mode | How material moves | Monitoring question it creates |
|---|---|---|
| Batch | Microorganisms grow in a fixed volume of medium. Nutrients are consumed, by-products accumulate, and the broth is removed at the end of the run. | Which changes mark growth, nutrient depletion, by-product accumulation, or the end of the useful run? |
| Fed-batch | Nutrients are supplied during cultivation. Feeding may be manual, linear, exponential, pulse-wise, or triggered by conditions such as biomass concentration or nutrient depletion. | When should feed be adjusted, and which substrate or biomass signal would support that decision? |
| Continuous culture | Fresh medium enters as culture material leaves. In a chemostat, the addition rate of a growth-limiting substrate controls cell multiplication. | Has the process moved away from its expected steady-state behavior? |
| Perfusion | Cells are retained in or recycled to the bioreactor while fresh medium enters and cell-free supernatant leaves at the same rate. | Are cell retention, feed, and removal behaving as intended over the extended run? |
Batch operation gives you a defined run with a changing culture environment. Fed-batch operation adds a controlled material flow to manage nutrient availability. Continuous and perfusion operation keep material moving while the process is expected to remain within an operating pattern over time.
The distinction is practical. A measurement that is adequate for an end-of-run batch assessment may arrive too late for a continuously operated process. For each mode, identify whether you need a historical explanation, a timely warning, or information that could support an operating decision.

Identify the changes that the process must reveal
Process measurements may cover temperature, pressure, mixing, pH, dissolved oxygen, gases, substrates, biomass, titer, and metabolic by-products. These variables describe different parts of the process: operating conditions, available nutrients, biological activity, and the material being formed or removed.
Measurements of substrates and metabolites can provide deeper insight into system behavior and support tailored control strategies. Real-time measurements can capture biomass, substrates, metabolites, or biomass composition and may enable an immediate response to changing process dynamics.
Nutrients and metabolic by-products can reveal trends or anomalies that may indicate an issue. Advanced analytics can support predictive modeling and proactive adjustments, but the useful question comes first: what change would alter your interpretation of the run, and how quickly would you need to see it?
A practical monitoring brief can separate three categories:
- Variables that describe the current process state, such as temperature, pH, pressure, or dissolved oxygen
- Materials that show biological consumption or formation, such as substrates, products, biomass, and metabolites
- Signals that may indicate an abnormal condition, such as an unexpected trend, missing result, or departure from an established relationship
An ethanol-fermentation study associated a glucose-feeding strategy guided by living-cell and ethanol changes with relative increases of 15.4% in ethanol concentration, 15.9% in productivity, and 9.0% in yield compared with the study’s reported baseline. Those three percentages describe the measured outcomes for that study’s fermentation and strategy; they do not establish the same outcome for another organism, vessel, feed strategy, or operating scale.

Place real-time monitoring within the measurement workflow
Process analytical technology, or PAT, uses timely measurements of critical process parameters or quality and performance attributes to support process design, analysis, and control. PAT connects measurement with process understanding; it is not automatically a particular sensor, model, or validated control strategy.
Process measurements may be in-line, on-line, at-line, or off-line. The terms describe where and how the measurement is made:
- In-line: A sensor is placed in the process.
- On-line: A bypass loop carries material to a measurement outside the bioreactor.
- At-line: An automated sample is connected to an analyzer near the process.
- Off-line: A sample leaves the process for analysis outside the bioreactor, and its result may arrive later.
The right arrangement depends on the information your process requires. If you need a continuous view of a changing stream, a delayed laboratory result may answer a different question from an in-line or on-line signal.
Real-time measurement can complement off-line sampling with at-line, on-line, and in-line information. Use the live result to add process context, not to discard established reference methods before the measurement, model, and operating use have been assessed.
This distinction also prevents a common category error: a fast signal may describe a physical or chemical change without yet providing a qualified concentration estimate or a basis for changing controls.
Match measurement timing to process behavior
Continuous processes require rapid and reliable detection of changes from steady state, so parameters may need on-line measurement to provide timely information. Traditional off-line sampling can delay process decisions, contributing to interest in continuous manufacturing and intensified bioprocessing.
Timing should follow the process question. A slowly changing variable may tolerate less frequent measurement, while a rapidly changing variable may require a much shorter interval. A live signal is useful only when it arrives quickly enough to inform the decision you are trying to make.
One precision-fermentation analysis set a scaling objective of moving from laboratory production to industrial volumes exceeding 100,000 liters. The same analysis set a cost-reduction objective of 50-80% compared with conventional methods. These figures describe stated scaling objectives, not a general result for every precision-fermentation process.
As scale and process duration change, define which measurements must remain visible, which changes require investigation, and which results may support an operating response. Do not assume that a measurement arrangement tested at one scale will represent a different vessel, stream, or operating environment.
Measurement frequency should match the variable’s rate of change. A typical fermentation illustrates the principle: pH and dissolved-oxygen tension may change over several minutes, culture fluorescence may change in less than 1 second, and measurable biomass changes may take an hour or more. These time scales describe that fermentation, not universal specifications for every process.
Your timing question is therefore more precise than asking whether a system is real-time. Ask how quickly the variable changes, when the result becomes available, and how much time remains for qualified interpretation.

Separate a live signal from decision-ready evidence
A live signal is not automatically a decision-ready result. Rapid, accurate, direct measurement is not available for every process variable, so measurement speed and frequency should match the variable’s rate of change. Monitoring data may also contain noise, variability, spurious or transient results, and instrument drift; signal conditioning or smoothing may be needed before control or modeling.
One industrial measurement overview lists an example set of criteria: accuracy within 1-2% of full scale, reliable operation for at least 80% of the time, low maintenance needs, steam sterilisability, simple and fast calibration, and maximum drift below 1-2% of full scale. The accuracy and drift figures describe full-scale measurement limits, while the 80% figure describes the listed minimum operating reliability over time. These are that overview’s stated criteria, not a universal acceptance specification for your process.
Use criteria like these only after defining the variable, range, environment, sampling route, and decision. A full-scale percentage cannot describe application fit by itself.
A spectrum is not the same as a model-generated concentration estimate. A laboratory result supports the conditions tested rather than automatically every pilot, pressurized, or plant condition. Model qualification should begin with the process and evaluate predictiveness and uncertainty because no single validation approach fits every model or bioprocess.
Before a result influences control, define the reference method, examine whether the samples represent the intended process range, and establish how uncertainty will be handled. Treat the measurement path, model, reference evidence, and operating decision as separate parts of the evidence chain.
Build the process description before comparing approaches
A monitoring assessment should begin with the process description, not with a preferred instrument. Before comparing approaches, define:
- The target substrate, product, or other measurement
- The expected concentration range, including its extremes
- Stream composition, phases, and solids
- Process temperature and pressure
- Sampling location and sample path
- The reference method
- The intended accuracy requirement
This information gives the measurement question a defined scope. It also exposes conditions that may change how the sample reaches the analyzer or how the resulting signal should be interpreted.
A useful supplier test brief should state the target measurement, expected range and extremes, matrix and solids, temperature, pressure, sampling location and path, reference method, available samples, installation context, and validation requirements. Include the process mode and the point at which the result would be used.
You can use the brief to compare like with like. Ask whether the proposed measurement sees the same stream, concentration range, temperature, pressure, and solids that matter in operation. If a test uses a different matrix or a narrower range, treat its result as evidence for that tested condition rather than as an automatic conclusion about the full process.
Your first practical action is to write the process question in one sentence: identify what must be measured, where it changes, how quickly it changes, and what information the result is meant to support. Then add the physical conditions that an analytical approach must face.
This brief also helps separate two questions that are often combined: whether a signal can be acquired, and whether the resulting measurement can support the intended decision. Keep both questions visible.
Frame the cost question around the monitoring requirement
Sophisticated tools for near-real-time biomanufacturing monitoring can be expensive and may require specialized operators. A typical price or price range is not stated because the relevant monitoring requirement must be defined for the process under consideration.
A cost brief should describe the parts of the measurement requirement that affect the assessment:
- The number and type of target measurements
- The concentration range and stream composition
- Temperature, pressure, phases, and solids
- The sampling arrangement and installation context
- Reference samples and method comparison
- Model development, validation, documentation, and operating checks
- The specialist time needed to run and interpret the system
These items are not interchangeable.
Treat cost as one part of an application-fit decision. A lower initial figure may not answer the process question if the sample path, reference evidence, model qualification, or operating support remains undefined.
To compare alternatives, use the same process brief for each option and separate acquisition cost from the work needed to establish, operate, interpret, and maintain the measurement. Do not compare instrument names or headline prices alone.
Investigate unexpected data before changing the process
A missing, inconsistent, or unexplained result, including a rising spectral residual, should start an investigation of the data path. It is not an automatic reason to change controls or make a disposition decision.
Use this order when a result conflicts with established process information:
- Check whether the sample or stream was representative.
- Examine measurement conditions, including the sample path and operating state.
- Test the model and compare the result with reference evidence.
- Reach an operating decision only after qualified review.
This sequence keeps an uncertain result separate from the process action it might eventually inform.
Contradictory data should be treated as a question about representativeness, measurement conditions, model behavior, or reference evidence before it is treated as proof that the process has changed. Preserve the established process controls while the discrepancy is investigated, unless qualified personnel direct a different action under the applicable procedure.
Document the result, the process state, the sample path, and the comparison with the reference method. That record lets the investigation distinguish a changing process from a changing measurement.

Seek qualified evaluation when the signal could affect safety or quality
A monitoring result that may affect safety, quality, process control, or an out-of-specification assessment requires qualified review before an operating or disposition decision. Seek immediate qualified technical, safety, quality, or regulatory help when the signal suggests an active hazard, a possible loss of process control, or a condition that could affect product quality.
If an established site safety or emergency procedure applies, follow that procedure rather than waiting for an analytical interpretation. Keep the concern visible, preserve the relevant data and conditions, and use the applicable escalation route.
Do not use an unqualified signal as the sole basis for changing controls, releasing material, rejecting material, or declaring that a process is safe. An uncertain result can initiate investigation, but the review should address representativeness, measurement conditions, model behavior, and reference evidence before a consequential operating decision.
Operating mode frames the monitoring question
Compare the operating mode before choosing what the monitoring question should capture:
- Batch: Microorganisms grow in a fixed volume while nutrients are consumed and by-products accumulate; the broth is removed at the end. The monitoring question concerns which changes need visibility during the run.
- Fed-batch: Nutrients are supplied during cultivation, manually or in response to conditions such as biomass concentration or nutrient depletion. The question links the feed pattern to the substrate, product, or other change to be observed.
- Continuous culture: Fresh medium enters as culture material leaves, and a chemostat uses the addition rate of a growth-limiting substrate to control cell multiplication. Changes from steady state may require rapid, reliable detection and on-line information.
- Perfusion: Ask whether the monitoring need concerns cell retention, incoming medium, or cell-free supernatant during the run.
Across the four modes, relate the target measurement to material flow and to the time scale of the change. This gives a mode-specific starting point for discussing monitoring.
A mode-first pass asks three questions: What enters, leaves, or accumulates? Which variable changes with that material flow? How quickly must the change be visible? In batch, the emphasis is depletion and accumulation; in fed-batch, nutrient addition and culture conditions; in continuous culture, departures from steady state; and in perfusion, cell retention and exchange streams.
Map how material moves, identify which changes require timely visibility, define the measurement conditions, and establish how uncertain results will be reviewed. That sequence helps you decide whether real-time analytics merit further technical discussion for your fermentation or continuous-bioprocess application.
What should you clarify before assessing bioprocess monitoring?
Can real-time bioprocess monitoring replace off-line laboratory testing?
Usually, it should be treated as complementary rather than an automatic replacement. A live signal can provide timely process context, while reference methods remain important for assessing the measurement, model, and intended use. Whether a result can support control or quality decisions depends on representative samples, measurement conditions, model predictiveness, uncertainty, and qualified review.
Which process information is needed to assess a bioprocess monitoring approach?
Define the target substrate, product, biomass, metabolite, or other measurement; expected concentration range and extremes; stream composition, phases, and solids; temperature and pressure; sampling location and path; reference method; available samples; intended accuracy; validation requirements; and the decision the result may support. Include whether the process is batch, fed-batch, continuous, or perfusion.
What should happen when monitoring data conflict with established process controls?
Treat the discrepancy as an investigation trigger, not as an automatic reason to change controls or make a disposition decision. First check sample representativeness and measurement conditions, then examine the model and reference evidence. Preserve established controls unless qualified personnel direct another action, and seek immediate technical, safety, quality, or regulatory review if the result may indicate a hazard, loss of process control, or an out-of-specification condition.
What does bioprocess monitoring typically cost?
There is no responsible single price for every application. Sophisticated near-real-time monitoring tools can be expensive and may require specialized operators. Compare options using the same process brief rather than instrument prices alone.