
bioprocess analytical monitoring
Bioprocess Analytical Monitoring: From Process Question to Qualified Action
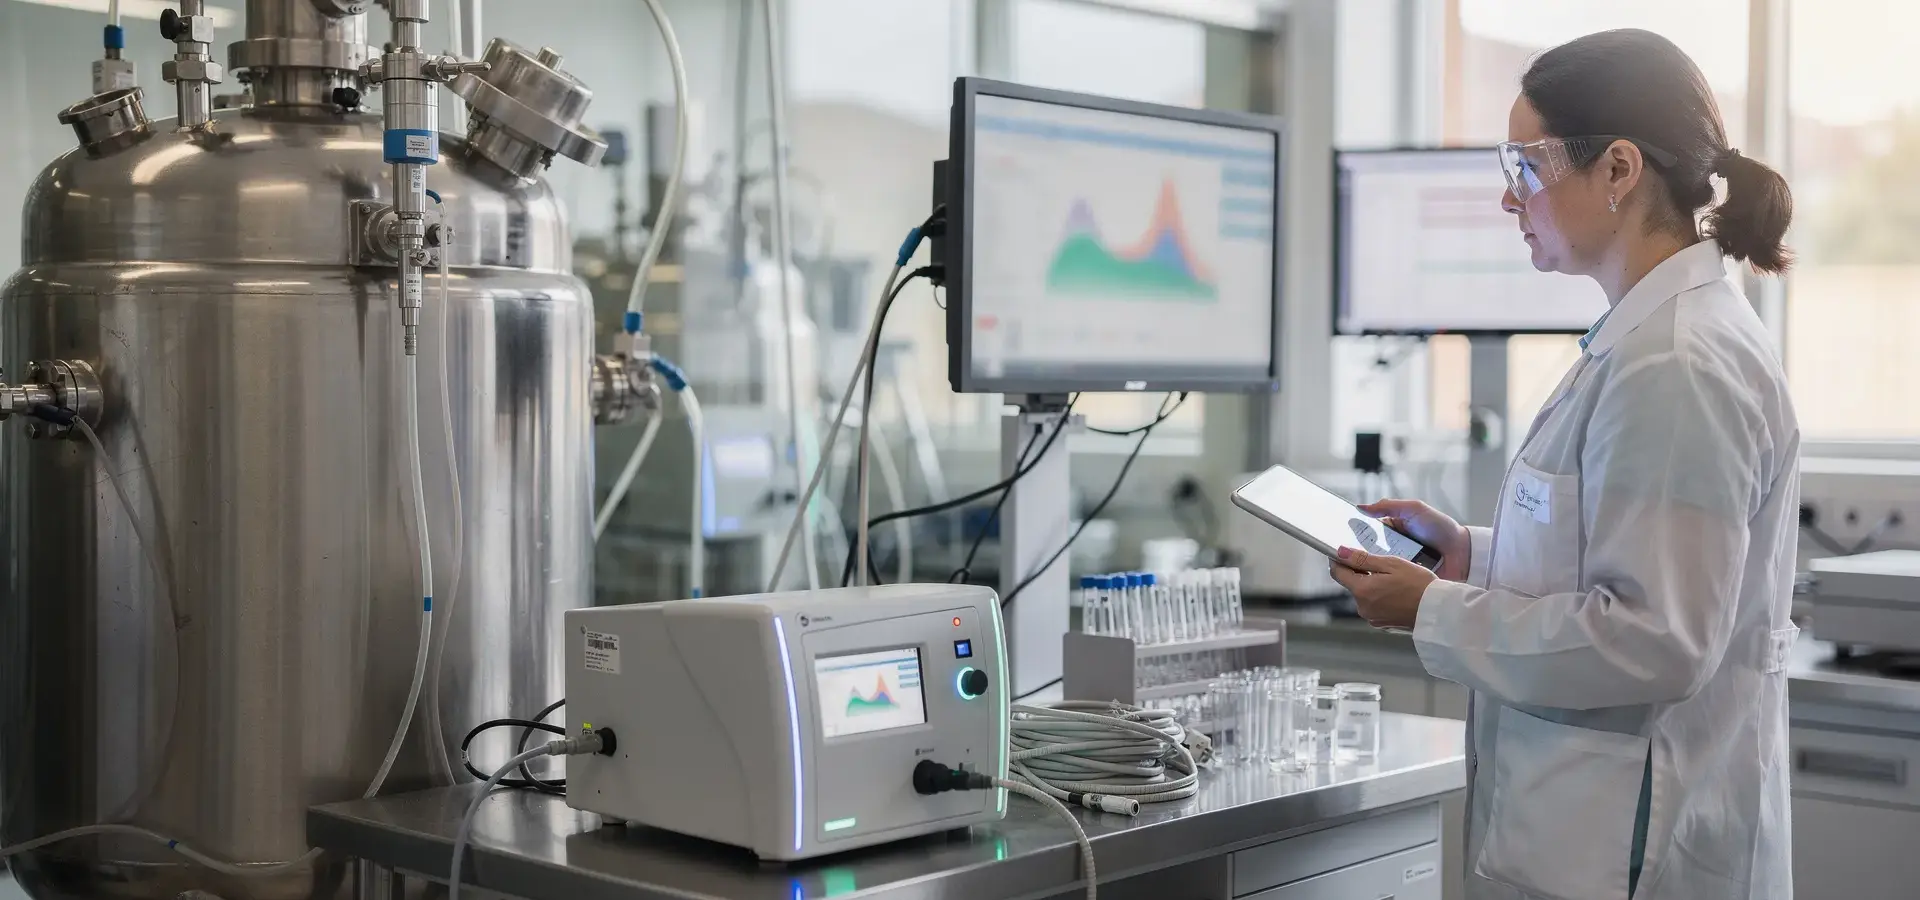
Use the evidence-to-action loop for uncertain data
Bioprocess analytical monitoring is most useful as a governed response to uncertain process information. A missing result, an inconsistent result, a rising spectral residual, or unexplained process variability should start an investigation of the data path—not an automatic change to controls or a disposition decision. The evidence-to-action loop therefore begins with representativeness and measurement conditions, tests the model and reference evidence, and reaches an operating decision only after qualified review.
Start by naming the measurement whose result matters: a process variable, critical process parameter, or critical quality attribute. Examples include pH, dissolved oxygen, temperature, conductivity, glucose, lactate, viable cell density, and product titer. Timely data may support trend, endpoint, development, or control decisions, but the intended use determines what evidence is needed.
The access mode remains part of that investigation. Off-line monitoring removes a sample for laboratory analysis; at-line monitoring analyzes a removed sample near the process; on-line monitoring diverts a sample through a by-pass stream for automatic measurement; and in-line monitoring places the sensor in the process without sample removal. Each arrangement creates different questions about representativeness, handling, response time, and reference testing.
Use the evidence-to-action loop for uncertain data:
- Check representativeness first. Review sampling location, mixing, aggregates, settling, carryover, matrix effects, and sample conditioning. An aseptic sampling strategy protects the culture from microbial contamination, while carryover from an earlier sample can influence a later measurement even when the culture remains uncontaminated. For online HPLC, cells and debris require sample conditioning because they are incompatible with most HPLC columns.
- Separate the measurement from the estimate. A spectrum is not the same as a model-derived concentration estimate. Compare the result with the reference method and examine sample preparation and handling; off-line measurement requires clear procedures and skilled personnel, and handling problems can decrease accuracy. A laboratory result supports the conditions tested rather than automatically supporting every pilot, pressurized, or plant condition.
- Test the model boundary. Check whether calibration samples span the expected concentration range, including its extremes, and whether the process conditions match the model’s evidence. Evaluate predictiveness, uncertainty, interpretability, and process-specific behavior. A rising spectral residual indicates that the instrument is detecting something the model was not trained on.
- Escalate before changing controls or making disposition decisions. If the discrepancy remains, or if the data suggest possible loss of control, involve qualified process, quality, or safety professionals promptly. Biological behavior and parameter dependencies can be poorly understood, particularly in mammalian cell culture, so qualified review is needed before treating an exception as an operating instruction.
This response path keeps monitoring useful without treating an isolated signal, estimate, or laboratory result as a decision on its own.
Name the decision the data must serve
The decision determines what you need to measure. Common in-situ measurements include pH, oxidation-reduction potential, dissolved oxygen, dissolved carbon dioxide, temperature, and conductivity. PAT can also support monitoring of glucose, lactate, viable cell density, and product titer through in-line, on-line, or at-line instruments rather than relying only on laboratory sampling.
For a particular bioprocess, the relevant critical quality attributes and critical process parameters depend on the biological molecule, manufacturing process, and historical knowledge base. That means a measurement list from another product or cell line is a starting point, not a process specification. Identify the attributes, parameters, and critical control parameters linked to the target product profile before you compare monitoring platforms.
The intended use also sets the necessary time scale. A data stream used to understand a batch trend has a different requirement from a measurement intended to support a feed adjustment or a continuous-process control decision. Timely measurements of critical quality and performance attributes can support proactive adjustment rather than waiting until the end of the process. Effective observability may also help you detect variability earlier, reduce manual intervention, and move from reactive correction toward more proactive control. Those are potential uses of the data, not automatic outcomes of installing a sensor.
Choose the time-and-access pattern
The monitoring mode determines how material reaches the measurement and how quickly information can return to the process. The four modes have different access, timing, and control implications:
| Mode | How the measurement is accessed | Reported timing | Practical use and boundary |
|---|---|---|---|
| In-line | A sensor measures inside the vessel or process stream without sample removal. | Continuous or seconds. | Suited to frequent observation; in-line Raman and FT-IR probes are used for real-time data acquisition. |
| On-line | A sample moves through a bypass stream to an instrument and may return to the bioreactor. | Minutes, depending on the method. | Can permit constant monitoring and real-time control, but requires a specifically designed or modified bioreactor. |
| At-line | A sample is removed manually or with an automated device and analyzed near the process. | 15–60 minutes. | Shortens delay relative to off-line testing; it may still be too slow for fast-growing microbial cultures. |
| Off-line | A sample is removed under sterile conditions, transported to a separate laboratory, and prepared for analysis. | 2–6 hours. | Useful for laboratory analysis, reference measurements, and analyzer validation, but the delay limits measurement frequency. |
The reported times describe a comparison of monitoring modes, not a universal performance specification for every method or site.
Offline testing remains relevant when the required attribute cannot be measured accurately in the vessel or bypass, or when a laboratory reference method is needed. It requires defined procedures and skilled handling, and errors during preparation or transfer can reduce result accuracy. In-line and on-line analyzers are commonly checked against offline laboratory measurements, so the modes are often complementary rather than mutually exclusive.
Sample conditioning can add another layer of delay. For online HPLC, bioreactor fluid containing cells and debris requires conditioning because those materials are incompatible with most HPLC columns. Inline filtration can add 2–5 minutes of dwell time, while dilution is simpler but can reduce sensitivity for low-abundance analytes. HPLC run times are reported as 5–30 minutes per injection, which supports its use for chromatographic characterization but affects how frequently the result can inform a process.
Separate signal, estimate, and decision
A spectrum is a measurement; a concentration estimate is a model output; a process action is a governed decision. Keeping those three layers separate makes it easier to identify where uncertainty enters the chain.
Spectroscopic methods can acquire data in situ without sample preparation and use multivariate analysis to estimate multiple target analytes at the same time. In pharmaceutical bioprocesses, ATR FT-IR has been used for in-line and on-line monitoring. Chemometric methods such as principal component analysis, partial least squares regression, and multivariate curve resolution can quantitatively estimate dissolved substrates and desired or undesired metabolites.
A soft sensor follows a related logic: it is a mathematical model that estimates an unmeasured variable from available process data. For example, several hardware-sensor signals may be used to estimate viable cell density, specific growth rate, or product titer. The estimate still depends on the data and model conditions that support it.
Do not treat a model-derived concentration as though it were the raw spectrum, and do not treat a laboratory result from one condition as automatic evidence for every pilot, pressurized, or plant condition. The measurement, reference result, model, and decision rule each need their own scope.
A cited fermentation study illustrates why performance figures need context. In that study, PLS models achieved root mean square errors of cross-validation of 0.22 g L−1 for Penicillin V and 0.32 g L−1 for phenoxyacetic acid. Those values describe the models and fermentation work reported in that study; they do not establish accuracy for your organism, matrix, concentration range, instrument, or operating conditions. Use comparable process samples and reference analysis when judging whether a model can serve your decision.

Protect representativeness at the process interface
The process interface can invalidate an otherwise well-designed analytical method. Sampling location, mixing conditions, aggregates, and settling can affect whether the material reaching the measurement represents the process, particularly when concentrations change substantially or long intervals separate samples. Select the location with the process flow and expected concentration gradients in mind, then test whether the collected material is representative.
Aseptic sampling protects the culture from microbial contamination, but aseptic handling does not remove every measurement concern. Carryover from an earlier sample can influence a later result even when the culture remains uncontaminated. Your sampling and cleaning procedure therefore needs to address both contamination control and material remaining in the path.
Matrix effects also matter for spectroscopy. An inline FT-IR assessment should investigate how the process matrix affects the signal, then address those effects through model development and validation against reference analysis. A calibration built on clean standards may not represent the turbidity, dissolved components, solids, or other conditions of the real stream.
If you use online HPLC, treat sample conditioning as part of the measurement rather than as an accessory step. Cells and debris in bioreactor fluid are incompatible with most HPLC columns. Inline hollow-fiber or flat-membrane filtration can add 2–5 minutes of dwell time, while mobile-phase dilution can simplify the path but reduce sensitivity for low-abundance analytes. Evaluate the complete sample path, including delay, fouling, carryover, and the effect of conditioning on the analyte.
Qualify the model against the process
Model qualification begins with the process, not with a preferred regression method. Bioprocess models require evaluation of predictiveness and uncertainty, and no single validation approach fits every model or bioprocess. Evaluate model quality early, including predictability and interpretability, before allowing an estimate to influence an operating decision. Well-designed measurements of key performance parameters and critical process parameters should be paired with a process model that describes relevant dependencies between critical quality attributes and process parameters.
Expect process specificity. Conventional partial least squares Raman models can become ineffective when operating conditions vary beyond the conditions represented in the model. Chemometric analysis also includes data pretreatments and diagnostics: pretreatments may improve the chance of a workable calibration, while diagnostics help demonstrate or quantify calibration performance.
Review the spectral region as part of the method. In some analyses, regions may need to avoid the highly absorbing water band around 5,150 cm−1. That is a method-design consideration, not a general exclusion rule for every spectrum.
Calibration transfer deserves a specific challenge. A reported calibration-transfer result indicates that off-the-shelf calibration transfer can reduce accuracy by 30–50%. Treat that as a warning about transfer risk rather than as a universal value: test the proposed model on your stream, operating range, instrument configuration, and reference method.
Connect measurements to operating decisions
A real-time result becomes operationally meaningful only when you define its data path and decision rule. In-line measurements can be sent to PLC or SCADA systems for automated control. In continuous manufacturing, in-line, on-line, and at-line PAT tools, soft sensors, and process models can collect data relevant to process dynamics and material quality. The integration must show how the result is timestamped, assessed, displayed, retained, and connected to an authorized action.
For continuous processing, describe the sampling location, sample size, frequency, statistical approach, decision criteria, and relevance to the intended use. If a model is involved, document the model type, evaluation strategy, and performance-monitoring strategy. This turns an instrument output into a traceable part of the control strategy rather than an isolated dashboard value.
Scale-up needs its own review. Changes in scale can alter residence-time distribution, process dynamics, and system integration, so the original control strategy may not remain applicable without assessment and modification. If a control system uses process parameters or in-process material-attribute measurements to support a decision such as pausing a continuous process or diverting material, define the conditions, authority, and review pathway for that decision before relying on automation.
Run a process-fit feasibility review
Prepare a technical brief before comparing instruments or asking for a feasibility test. Include the following:
- Decision and measurand: State the substrate, product, metabolite, cell-related variable, quality attribute, or process variable you need to estimate, and describe the decision it may support.
- Stream and operating conditions: Describe composition, expected concentration range, temperature, pressure, solids, mixing, flow, and the intended sampling or sensor location.
- Performance requirement: State the intended accuracy requirement, response time, measurement frequency, and acceptable uncertainty for the decision.
- Reference method: Identify the laboratory or other reference method, its sample preparation, and the conditions under which its result is meaningful.
- Access pattern: Decide whether in-line, on-line, at-line, or off-line access matches the process, sterility constraints, and required latency.
- Calibration coverage: Build calibration samples across the expected measurement range, including its extremes.
- Model evidence: Specify how you will assess predictive performance, uncertainty, interpretability, residuals, and behavior under expected process variation.
- Implementation: Consider sample requirements, robustness, maintenance, data integration, model maintenance, and scale-up implementation. These are among the dimensions used to evaluate quantitative PAT tools.
For a site in North America, South America, Europe, or Asia, keep the same technical brief while adding the local quality, engineering, classified-area, and regulatory requirements that apply to the installation. The measurement question remains the starting point.
Investigate a broken data path before acting
Missing, inconsistent, or implausible monitoring data require a structured check before you change a process action. Work through the path in order:
- Confirm that the sample or sensor location represents the process at the time of measurement. Check mixing, settling, aggregates, carryover, and any delay in the line.
- Review sample preparation, filtration, dilution, instrument status, and the applicable operating procedure. Offline measurement depends on clear procedures and skilled handling, and problems during preparation or handling can reduce accuracy.
- Compare the result with the reference method and confirm that both describe the same material and operating condition. Do not silently substitute a model estimate for a missing reference result.
- Check whether the model covers the current process conditions, concentration range, matrix, and scale. Online sensors or offline measurements can address upstream monitoring and testing preconditions, but model predictability and interpretability still require early evaluation.
- Record the discrepancy, preserve the raw signal and metadata, and route the issue through the site investigation procedure before changing a control or disposition decision.
Infrequent measurement of biological parameters can make process control difficult and may increase the risk of batch failure, so a missing result should not be treated as harmless simply because another parameter remains available.
A cited perfusion study shows why a reported benchmark must remain tied to its study conditions. Its Raman glucose model had a root mean square error of prediction of approximately 0.2 g/L and was used to control an external glucose feed. In that study, inline Raman measurement and chemometrics maintained glucose first at 4 g/L and later at 1.5 g/L over several days, with fluctuations of less than ±0.4 g/L. The model used data from perfusion cultivations at 1–10 L working volume and perfusion rates from 1 VVD to 5.5 VVD. These figures describe that study; they do not establish a target, tolerance, or expected result for your process.

Escalate signs of possible loss of control
Biological processes can be difficult to monitor in real time because biologics are more complex in structure and manufacturing process than small-molecule chemical drugs. In upstream processing, the dynamic behavior of cells and the dependencies between parameters, especially in mammalian cell culture, may not be understood in sufficient detail for an unexplained estimate to support an immediate change.
At Paeonia Innovations, we consider residual monitoring essential for model maintenance. A rising residual can mark a boundary in the model’s demonstrated scope. Treat that signal as an investigation trigger: check the process, sample path, instrument, reference result, and model scope before interpreting the estimate.
Do not change feeds, operating limits, process disposition, or diversion decisions solely because an unexplained model output appears. Escalate promptly to qualified process, quality, and safety personnel when data suggest possible loss of control, contamination, an unsafe condition, or a decision outside the model’s demonstrated scope. Preserve the data and follow the applicable site procedure while the issue is assessed.
Send the technical brief
A feasible monitoring plan starts with a clearly stated process question. Have the target measurement, decision use, stream conditions, access pattern, reference method, calibration range, model-performance questions, sampling plan, and scale-up concerns ready for a technical discussion. That preparation makes it possible to distinguish a promising measurement from a qualified basis for action.
A qualified process, quality, or safety professional must decide individual suitability, operating changes, validation requirements, and disposition actions for your site. Use the framework above to define the questions that need review.
What should you clarify before discussing bioprocess analytical monitoring?
Is bioprocess analytical monitoring limited to continuous manufacturing?
No. It can support batch, fed-batch, perfusion, and continuous processes through off-line, at-line, on-line, or in-line measurements. The appropriate approach depends on the process decision, required response time, sampling conditions, and whether the measurement can be qualified for the intended use.
Can real-time monitoring replace offline laboratory testing?
Usually, it complements rather than replaces laboratory testing. Real-time methods can provide frequent information about process variables, nutrients, metabolites, or other modeled attributes, while offline methods may remain necessary for reference analysis, validation, or attributes that require laboratory-specific separation or characterization. The relationship should be established for the specific process and method.
Which process measurements may still require laboratory analysis?
Measurements that cannot be represented accurately in the vessel or bypass, or that require laboratory-specific characterization, may remain at-line or offline. For example, chromatographic methods can provide separation of structural species such as charge variants, aggregates, and fragments. Confirm the required attribute, reference method, sampling conditions, and intended decision before assuming an in-line or modeled estimate is adequate.