
reaction and process monitoring
Reaction and Process Monitoring: How to Assess In-Line Mid-Infrared Measurement
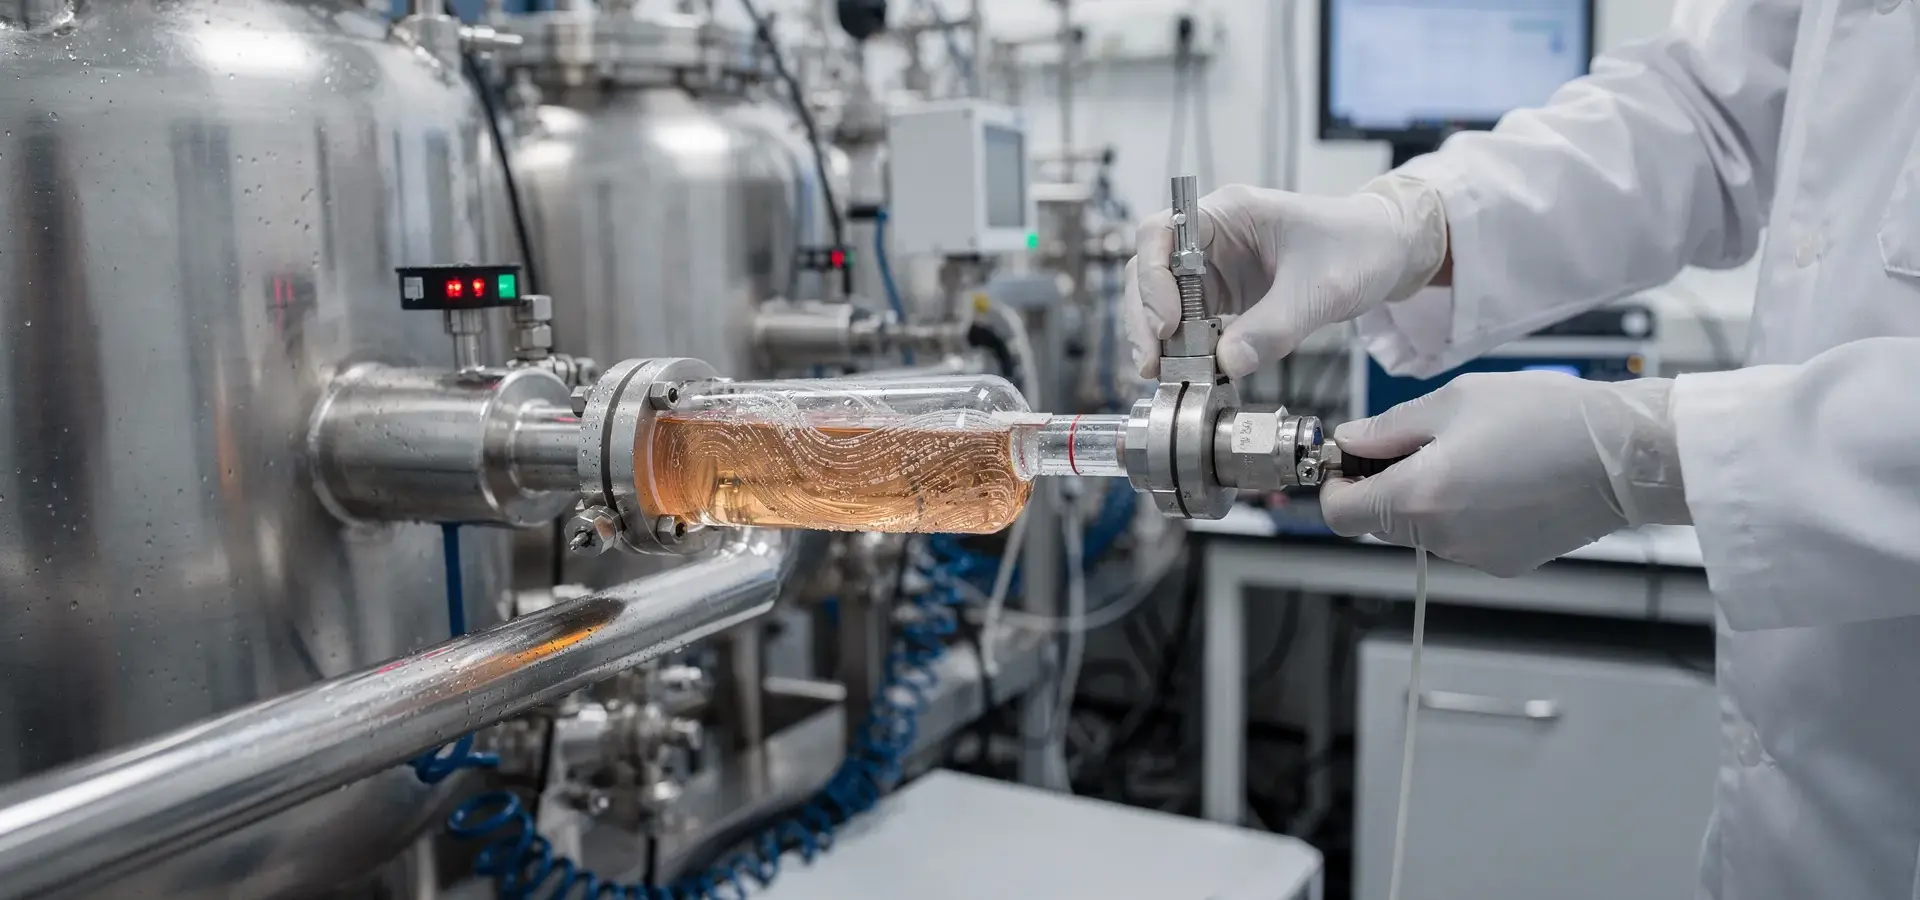
Begin with the process decision
Reaction and process monitoring should begin with the process decision you need to make, not with a particular instrument. Define whether you need to follow composition, identify a reaction endpoint, detect a change in a process stream, understand mixing, or support a control strategy. The required answer determines the measurement, sampling route, reference method, and validation effort.
Process Analytical Technology uses monitoring techniques to measure Critical Process Parameters and improve process analysis, design, and control. Mid-infrared spectroscopy can contribute composition information because mid-IR light is absorbed at energies associated with molecular-bond vibrations. A spectrum can therefore indicate what is present and how much of it is present, provided the chemistry, concentration range, sample presentation, and model support that interpretation.
That distinction matters in pharmaceutical, specialty-chemical, petrochemical, food, cosmetics, and research settings. A spectrum is an observation. A process decision requires a defined relationship between that observation and the property you need to understand. If your question is only whether a reaction is changing, a trend may be sufficient for an early investigation. If your question is whether a quantitative endpoint has been reached, you need a stronger calibration and an independent reference comparison.
Start by writing the decision in one sentence: “What must change, remain within a range, or be confirmed before the next process step?” Then identify the composition or process information that would answer it. Instrument selection comes after that definition.
Separate in-line measurement from offline sampling
Measurement location determines how quickly data describe a changing reaction or process stream. In-line methods measure the process stream directly without removing or diverting a sample. On-line methods automatically take samples for analysis and may return the sampled material to the process. At-line methods remove material for nearby analysis, while offline methods create a larger time and distance gap between sample extraction and final data generation.
Offline sampling can introduce delay between the process event and the result. An in-line measurement reduces the separation between the process and the detector, but it does not automatically make the result representative or quantitative. Sampling geometry, flow, temperature, bubbles, solids, and calibration still govern what the signal means.
Use the modalities as distinct operating choices:
- In-line: measure directly in the process or through a flow-through arrangement connected to it.
- On-line: measure material through a bypass loop, with automated return possible in some systems.
- At-line: remove material and analyze it close to the process, potentially with automated sampling.
- Offline: send a sample to a laboratory or other separate analytical location.
The time advantage of a faster modality matters only when the process changes on a timescale that the measurement can resolve. A bioprocessing source describes typical Raman collection at one new measurement every 10 to 15 minutes, compared with traditional offline sampling typically performed once or twice per day. Those figures describe the cited bioprocessing context, not a universal schedule for every Raman or offline workflow. Choose the route by matching response time, sample behavior, required evidence, and the decision the result will support.

Map timely data to reaction and process decisions
Monitoring data becomes useful when you connect a measured change to a defined process response. Composition trends can show whether a reaction is progressing, whether a mixing step is approaching homogeneity, or whether a continuous process is behaving as expected. The same data should not be treated as a release result, a control signal, and a diagnostic trend without separate evidence for each use.
For mixing work, homogeneity measurements can identify mixing endpoints, while flow-pattern measurements can reveal islands, dead zones, channelling, or cavern formation. For continuous manufacturing, PAT measurements can support confirmation of satisfactory operation, model verification, divert-to-waste decisions, feedback control, and residence time distribution measurement. The appropriate use depends on the process design and the consequences of acting on the result.
A practical decision map looks like this:
- Trend monitoring: use repeated measurements to see whether a composition or process condition is moving in the expected direction.
- Endpoint assessment: connect the trend to a defined endpoint criterion and confirm the interpretation with an appropriate reference method when the endpoint is quantitative or consequential.
- Model verification: compare measured behavior with a process or residence-time model rather than assuming agreement from a single run.
- Process control: define the response, limits, and review path before allowing a measurement to influence operation.
- Quality assessment: establish whether the measurement is being used directly for a Critical Quality Attribute or as an input to a larger model that includes process parameters and material attributes.
Keep the offline laboratory connected to the in-line system for validation and investigation of quality excursions.
Screen the stream before choosing mid-infrared
Mid-infrared feasibility depends on the chemistry and process conditions, not on the instrument name alone. Infrared spectroscopy is not suitable for every chemical sample. Before you select a configuration, define the analytes, concentration extremes, composition changes, temperature, pressure, water, solids, bubbles, homogeneity, sampling geometry, and the decision the measurement must support.
Mid-infrared spectroscopy operates across 400–4000 cm⁻¹ and triggers fundamental vibrations of chemical bonds and functional groups. An IR spectrum can show absorption peaks on a wavenumber axis from 4000 cm⁻¹ to 400 cm⁻¹; peak positions depend partly on atomic masses and bond strengths. Turning those spectral features into concentration or endpoint information requires a suitable optical path and a model that covers the process domain.
Aqueous streams require particular attention. The optical path length must be short enough to prevent the water background from saturating the detector and must match the concentration range being resolved. Temperature must be controlled or compensated, and the model must be multivariate so that the spectral pattern can separate analyte information from background effects.
Use a screening record with these fields:
- analytes and likely intermediates;
- expected concentration range, including low and high extremes;
- solvent or water content and composition changes;
- temperature and pressure range;
- solids, bubbles, settling, and homogeneity concerns;
- required response time and intended decision;
- available optical access and cleaning conditions.
FT-IR has been described as configurable for in-situ measurement from development reactors with vessel volumes below 50 cm³ to manufacturing plants above 1000 L, but that range describes possible physical scale, not automatic application suitability. OrionIR® uses a 0.1 mL flow cell to generate one spectrum per second. That capability can be relevant to a fast-changing stream, but the chemistry and sampling arrangement still determine whether the data answer your process question.

Make the measurement see a representative process
A representative measurement begins with the material that reaches the detector. Sample representativeness depends on sampling location, mixing, aggregates, settling, carryover, matrix effects, and sample conditioning. A result can be precise for the collected sample and still fail to describe the process stream if the collection point or handling path changes what reaches the measurement.
Treat the sample interface as part of the analytical method. For a recirculation loop, ask whether the loop receives material that reflects the vessel or process zone relevant to your decision. For a side stream, examine residence time, flow conditions, settling, and the possibility that the side stream changes composition before measurement. For a bench or development setup, record how the material is introduced, mixed, cleaned, and returned or discarded.
A feasibility test should account for residence time, optical access, cleaning expectations, and water, solids, or bubbles. Installation details belong in the test brief rather than being left as a later procurement detail. Include the following in that brief:
- the proposed measurement location and flow path;
- the expected delay between the process and the detector;
- mixing, settling, carryover, and conditioning behavior;
- the cleaning cycle and materials that may remain on optical surfaces;
- pressure, temperature, and access constraints;
- the process question that the presented material must represent.
The central test is simple: can you explain why the material seen by the detector represents the process state you intend to interpret? If the answer is uncertain, resolve the sampling path before judging the spectrum or model.
Match acquisition frequency to process behavior
Acquisition frequency should follow reaction duration, expected rate of change, and available signal-to-noise rather than the fastest setting an instrument can provide. Modern in situ spectrometers allow continuous spectral collection, but the useful interval depends on whether the reaction changes over seconds, minutes, hours, or days and whether each spectrum has sufficient signal quality.
For a reaction completed within a few minutes, collect spectra every few seconds if signal-to-noise is sufficient. For a reaction taking a few days, avoid acquiring spectra so frequently that the data volume grows without adding decision value. If the starting frequency is uncertain, try one minute per spectrum and adjust as you observe the process.
Set the interval by asking three questions:
- How quickly could the process cross the decision boundary?
- How long does the measurement need to acquire a usable spectrum?
- What signal-to-noise level is required for the trend or model?
OrionIR® is described as generating one spectrum per second with a 0.1 mL flow cell, but that capability does not require you to use one-second acquisition for every process. A faster stream of weak or redundant spectra may be less useful than a slower stream that captures a reliable process change. Define the interval during the feasibility study and record the reason for it.

Choose trend evidence or quantitative calibration
A feasibility study should distinguish a process trend from a quantitative result. For a simple, well-understood reaction, calibration experiments can use solutions with known concentrations of the reaction species. If your early question is only whether the process is changing, a team may sometimes skip calibration and examine the spectral trend instead. That shortcut does not establish quantitative concentration or a validated endpoint.
For a complex reaction system in which the expected spectral changes are unknown, measure spectra from the real reaction. The resulting data can show whether the changes are subtle or significant and can indicate whether intermediate species may be involved. New peaks that are absent from starting materials and products, or patterns in residual spectra, can guide the design of a later calibration set.
Choose the study path by the decision you need to support:
- Trend question: collect time-resolved spectra and define what pattern would justify further investigation.
- Known-composition question: prepare solutions with known concentrations of the relevant reaction species and examine how the spectra respond across the intended range.
- Unknown-reaction question: measure the real reaction first, then use what you observe to design representative calibration experiments.
- Quantitative endpoint or kinetics question: plan independent reference testing from the beginning, because a trend alone cannot establish the required quantitative relationship.
A simple trend study can be a sensible first step, but keep its boundary explicit. Do not convert a visible spectral change into a concentration, endpoint, or control instruction until the calibration and reference evidence support that use.

Build the model around the process domain
A quantitative model needs a calibration set that represents the process domain, including the expected concentration extremes. The model should not be trained only on convenient central samples if the deployed process will encounter low or high concentrations, changing feedstocks, temperature shifts, solids, bubbles, or other composition changes.
Define the domain before collecting data. Record the analytes, concentration range, process stages, expected matrix changes, temperature and pressure conditions, and the operating boundaries where the model will be used. The calibration set must span the expected concentration range, including the extremes. The material presented during calibration must also represent the process question and the measurement path.
Validate the multivariate model with independent test data and compare its results with predetermined performance criteria. Independent data matter because a model can appear strong on samples used to fit it while performing differently on unseen process material. Predetermine the performance criteria before judging the result, and keep the criteria connected to the decision rather than to a generic instrument specification.
The reference method sets a hard boundary on interpretation. Predicted values cannot be more accurate than the reference method used for training; the reference method’s reproducibility determines the model’s accuracy floor. If the reference method has variability that is material to your decision, the model cannot remove that limitation by producing more frequent predictions.
A practical model record should identify:
- the process and concentration domain;
- the reference method and its reproducibility;
- the calibration samples and their coverage;
- the independent test samples;
- the predetermined acceptance criteria;
- conditions that place a sample outside the model domain.
Model-domain limits should be treated as deployment boundaries.
Keep in-line results connected to reference methods
If your goal is a quantitative reaction endpoint or a rigorous kinetics model, validate the in situ spectroscopy results with another primary analytical technique such as GC, LC, or NMR. The reference method is not merely a troubleshooting tool; it anchors the meaning and limits of the model output.
Flag samples outside the model domain and route them to the reference method. An out-of-domain result should not be treated as an ordinary prediction simply because the instrument produced a spectrum. Define the conditions that trigger the flag, the person or team responsible for review, and the action that follows.
A change in measurement conditions or instrument can require calibration adjustment, additional evidence, or redevelopment. Calibration transfer therefore needs its own check. Use independent paired samples, agree acceptance limits in advance, and use the reference method as the judge of whether the transferred result meets the intended criteria. This applies when a model moves between instruments, sampling arrangements, process conditions, or materially different feedstocks.
Keep the following loop active after deployment:
- Compare selected in-line results with reference results.
- Investigate disagreement rather than averaging it away.
- Check whether the sample remains within the model domain.
- Review changes in temperature, feedstock, product specification, instrument, and sampling path.
- Revalidate or update the model when the process domain changes.
Most facilities maintain an offline laboratory to validate inline sensor performance and investigate specific quality excursions in greater detail. Keep that relationship visible in the operating procedure.
Plan implementation as a cross-functional process
PAT implementation is an iterative process that takes time, with manufacturing, quality control, and research and development staff working together to develop measurement and control strategies. A technically plausible spectrum is only one part of implementation. The operating team also needs agreement on the process question, sampling arrangement, reference method, model use, review responsibilities, documentation, and response to an unexpected result.
Build the implementation plan around the intended use of the data. A trend used by process development may need a different evidence package from a model that informs a control action or a quality decision. Define who reviews the data, who can change an operating condition, when reference testing is required, and what happens if the result falls outside the model domain.
The level of effort, formality, and documentation in quality risk management should be commensurate with the level of risk. That principle applies whether your site is in North America, South America, Europe, or Asia. Local site procedures, regulatory expectations, containment requirements, classified-area controls, and continuous-manufacturing arrangements still govern the implementation decision.
Bring the relevant groups into the same review:
- process development and R&D for chemistry, kinetics, and model purpose;
- manufacturing or operations for installation, workflow, and response actions;
- QC for reference methods, sampling, and investigation;
- QA and qualified engineering or validation personnel for the site-specific evidence and approval path.
Treat implementation as a staged decision. First establish that the measurement sees the right material. Then establish that the model answers the defined question. Only after those points are supported should you decide how the result enters routine process management.
Prepare a Paeonia Innovations feasibility discussion
A feasibility discussion with Paeonia Innovations is most useful when you bring a defined process question and enough stream information to assess the complete measurement system. Evaluate the spectrum, calibration, reference method, sampling arrangement, installation, software, and lifecycle support together rather than treating the spectrometer as an isolated purchase.
We offer to test OrionIR® on your process samples when it makes sense. We require the stream composition, concentration range, required accuracy, temperature, pressure, and presence of solids to start the testing process. Add the operating details that affect representativeness and installation:
- the reaction or process question and the decision it must support;
- analytes, likely intermediates, and stream composition;
- expected concentration range, including extremes;
- temperature, pressure, water, solids, bubbles, and homogeneity;
- residence time, flow path, optical access, and cleaning expectations;
- available representative samples and the proposed reference method;
- sampling location, installation constraints, and any site review requirements;
- whether the intended result is a trend, concentration estimate, endpoint, model input, or control signal.
We develop models using calibration against your chemistry and reference method and validate them on unseen batches. We provide documentation of preprocessing and validation to make the model transferable and auditable. We offer ongoing chemometric-model support, including revalidation or model updating when feedstock, temperature, or product specifications change. Those services describe Paeonia Innovations’ configured support; they do not establish suitability for every stream or operating condition.
We use OrionIR® to determine what is in the liquid and how much, while our RTD module measures how long material spends inside the vessel. Our OrionIR® Lab version is designed for recirculation loops off a reactor, side streams on pilot rigs, and bench setups. Describe your proposed arrangement so the technical discussion can address whether that configuration matches the process question.
Escalate decisions that can affect safety or quality
A reaction endpoint is a Critical Process Parameter for safety, product quality, and plant efficiency. Running a reaction beyond its endpoint risks unstable or reactive byproducts, unnecessary power use, and lower plant efficiency. Stopping a reaction early risks lower product yield and may require more batches to obtain the desired annual production. Reaction endpoints can vary between batches because of incoming-material quality, environmental pressure and temperature, and catalyst quality.
Real-time monitoring and process models can identify deviations from anticipated process progression, and control measures can be implemented to return the process to desired specifications. Those possibilities do not make an unvalidated signal a substitute for site procedures, qualified engineering review, process hazard assessment, reference testing, or applicable authority requirements.
Escalate promptly when the monitoring result could affect:
- containment, worker protection, or classified-area operation;
- plant operation, divert-to-waste action, or feedback control;
- a decision outside the validated process or model domain.
For those situations, involve the responsible process, safety, quality, engineering, and regulatory personnel before changing the operation. Keep the monitoring result as one input to the decision until the measurement, model, and response path have been reviewed.
The appropriate response depends on your site procedures and the hazard. If an immediate safety, containment, or plant-operation concern exists, follow the site emergency and escalation pathway and contact the responsible qualified professional or authority promptly.
Send a process brief for the next step
A defined process brief gives you a practical starting point for deciding whether in-line mid-infrared measurement is plausible. State the process question, stream composition, concentration range, required accuracy, temperature, pressure, solids, representative samples, sampling path, reference method, and intended use of the result. Keep qualified site review in the decision whenever monitoring could affect safety, quality, containment, or plant operation.
If those details point to a plausible application, Paeonia Innovations can assess the process information and, when it makes sense, test OrionIR® on your process samples. Individual suitability still requires application-specific evaluation by qualified professionals.