
ir machine chemistry
IR Machine Chemistry: How Infrared Spectroscopy Turns Samples into Chemical Evidence
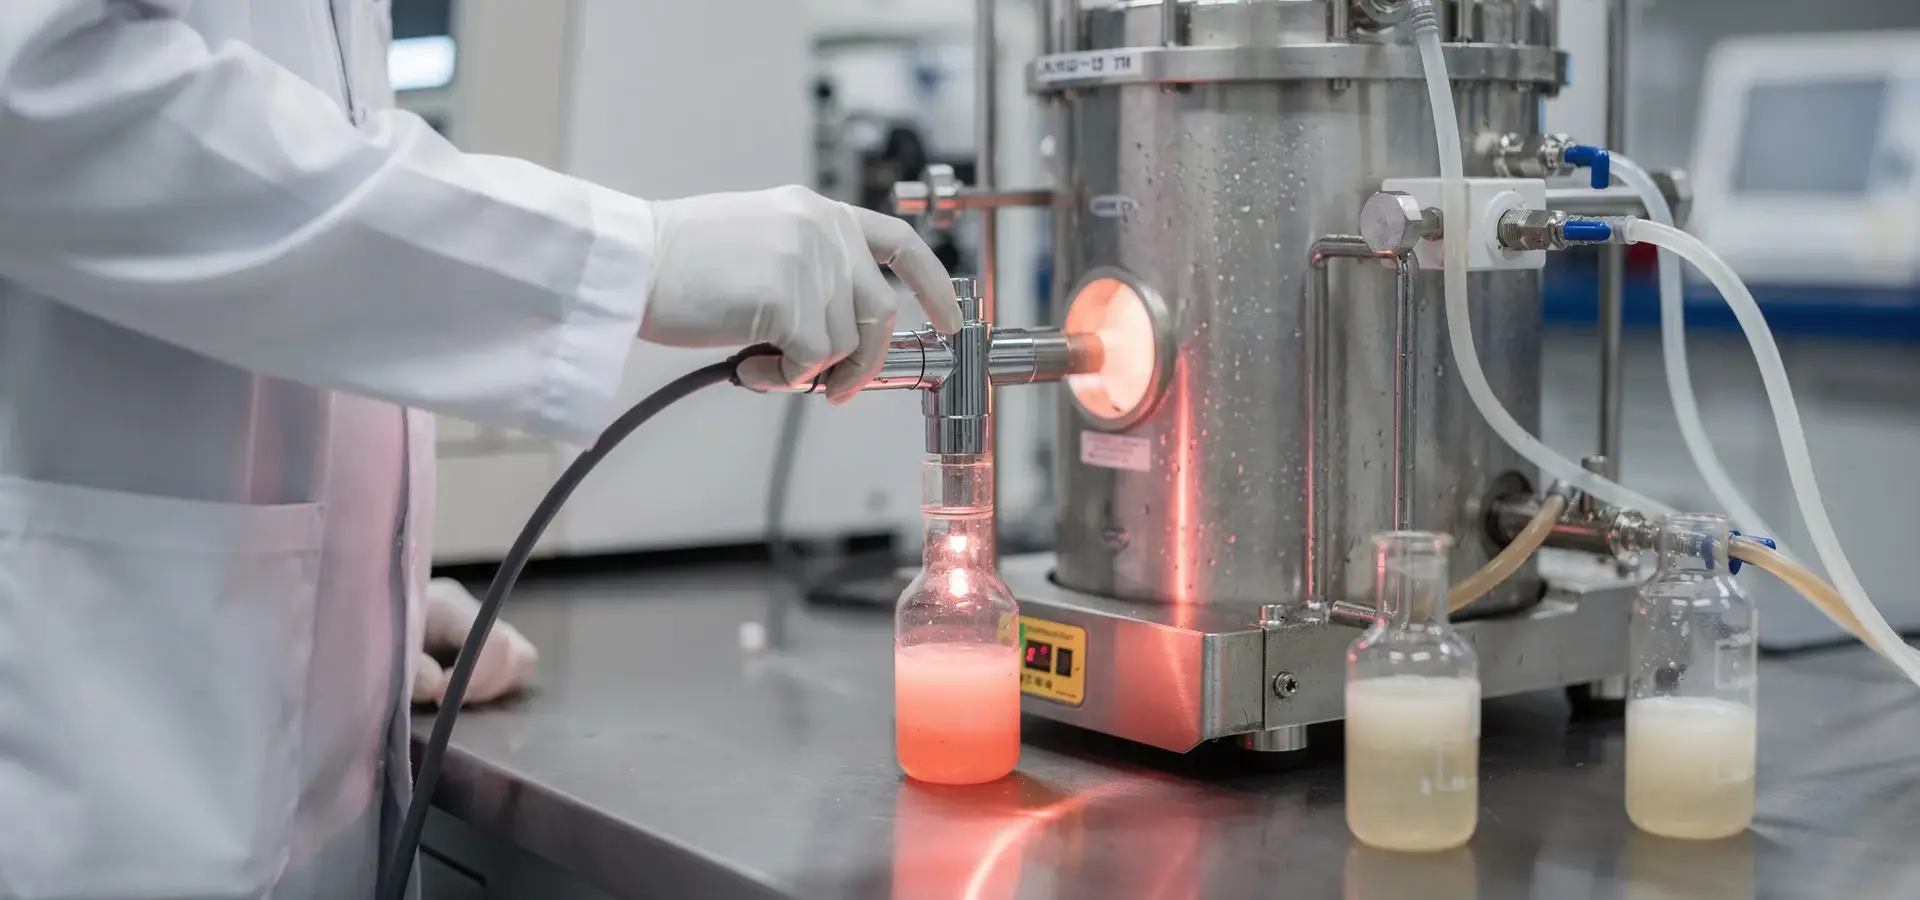
What an IR machine actually includes in chemical analysis
An IR machine is an infrared spectrometer that measures how a sample interacts with infrared light and records the resulting data. The instrument is the hardware and optical system; the measurement is the interaction between light and the sample; the spectrum is the recorded pattern; and interpretation connects that pattern to a chemical question.
Infrared light lies between visible light and microwaves in the electromagnetic spectrum, with wavelengths ranging from 780 nm to 1 mm. An infrared spectrometer selects or processes part of that range, detects how the sample changes the light, and presents the result using signal intensity against wavelength or wavenumber.
A useful way to separate the parts is:
- Instrument: the source, optical path, detector, electronics, and software that collect spectral data.
- Sample measurement: the way light reaches the material, such as transmission, reflection, or contact with an ATR crystal.
- Spectrum: the measured signal pattern, including bands, peaks, baseline, shape, and intensity.
- Interpretation: the chemical assignment, comparison, classification, or calibrated estimate made from that pattern.
A spectrum is therefore an observation, not automatically a concentration result. The value of the observation depends on whether the sample presentation, measurement conditions, and interpretation fit the question you need to answer.
Follow infrared light from molecular motion to spectral information
Infrared radiation can excite molecular-bond vibrations, including stretching and bending modes. A bond does not absorb every infrared frequency: particular frequencies interact with particular vibrational motions, so the sample selectively changes the radiation that reaches the detector.
Certain infrared wavelengths are absorbed when they match chemical-bond vibration frequencies, and the resulting spectrum records those absorptions. The recorded bands are not photographs of molecules; they are measured responses that analysts interpret in relation to bond types, functional groups, composition, and the measurement setup.
Mid-infrared spectroscopy operates within 400–4000 cm⁻¹ and triggers fundamental vibrations of chemical bonds and functional groups. An IR spectrum can show absorption peaks on a wavenumber axis running from 4000 cm⁻¹ to 400 cm⁻¹; peak positions depend partly on atomic masses and bond strengths.
Band position, shape, and intensity may provide information about molecular vibrations, functional groups, composition, physical state, or chemical change, depending on the measurement design. A change in a band may reflect a change in composition, but it may also reflect scattering, reflection, path length, water, temperature, or another condition that changes how the sample presents itself to the instrument.

Read spectral features without treating IR as a complete structure solution
Infrared spectroscopy can help identify functional groups by measuring molecular vibrations. This makes an IR spectrum useful for checking whether chemical features associated with a material are present and for comparing samples whose composition or treatment may have changed.
IR spectroscopy does not generally determine the whole structure of an unknown molecule; it is useful for identifying specific functional groups and can complement other techniques. If your question requires a complete structural assignment, treat IR as one source of chemical information rather than the entire analytical answer.
IR spectroscopy detects vibrations that cause a change in molecular dipole moment, so symmetric homonuclear diatomic molecules such as O₂ or N₂ do not show up in IR analysis. This physical boundary matters when you decide whether the target species has an infrared-active vibration that can produce a usable signal.
For an initial interpretation, ask what the spectrum can establish and what it cannot establish:
- A characteristic band can support the presence of a functional group.
- A change in band shape or intensity may indicate a chemical or physical change when the measurement conditions remain comparable.
- A spectral match can support identification when the sample, reference material, and sampling route are comparable.
- A spectrum alone does not establish a validated concentration, complete molecular structure, or suitability for a process decision.
That distinction keeps the analytical question aligned with the information the measurement can actually provide.

Match the instrument and sampling route to the measurement question
A dispersive spectrometer separates infrared radiation into wavelengths for separate measurement, whereas an FTIR spectrometer uses an interferometer and mathematical transformation to produce a spectrum. The instrument architecture is one part of the decision; the sample path and the information required are equally important.
The three main FTIR measurement techniques are transmission, ATR, and reflection, and each is suited to different purposes. Transmission sends the IR beam through the entire sample. ATR places a condensed-phase sample against a high-refractive-index crystal and uses total internal reflection. Reflection measures light returned from the sample surface.
| Sampling route | Where the interaction occurs | Questions to resolve |
|---|---|---|
| Transmission | The IR beam passes through the entire sample. | Can you control thickness and homogeneity, or will the sample absorb too much light? |
| ATR | The measurement is concentrated at the contact surface, with penetration typically on the order of a few micrometres. | Is the surface representative, and can the sample make even contact with the crystal? |
| Reflection | The detector measures IR light reflected from the sample surface. | Is the surface accessible and representative, especially for a solid that is difficult to analyze by transmission or ATR? |
Transmission requires IR light to pass completely through the sample; a sample that is too thick can cause total absorbance and poor spectral quality. For mid-IR qualitative work, transmission can use a very thin sample of approximately 10 micrometers while measuring absorbed light. That example illustrates why thickness is a method parameter, not a minor handling detail.
Where IR spectroscopy fits in chemistry and process work
IR spectroscopy is commonly used for qualitative identification, including in forensic work, plastic recycling, failure analysis, and quality control. Mid-infrared spectroscopy is also used in research, quality control, and industrial applications for identifying chemical compounds, monitoring reactions, and studying molecular structures.
IR spectroscopy is used in pharmaceuticals and other consumer industries to test samples for unwanted contaminants and across biochemical industries to test selected proteins and other organic compounds. Infrared spectroscopy is also used to detect and quantify gases because compounds such as CO₂, CH₄, and NOx absorb IR light at specific wavenumbers.
IR spectroscopy can be fast and non-destructive, allowing high-throughput testing, and samples can often be recovered afterward. Those properties can fit laboratory screening, quality-control checks, reaction monitoring, and process measurements, but speed does not remove the need to establish representative sampling and a suitable interpretation method.
We describe a repeatability test in which OrionIR® held its spectral stability for more than 100 days. That is a first-party result for that test, not a general conclusion about every IR instrument or every operating environment. If you are considering continuous manufacturing or process monitoring, treat stability under your own sampling and installation conditions as a separate question.
Separate a spectrum from a quantitative chemical result
Infrared spectroscopy supports both qualitative and quantitative analysis, but quantitative infrared analysis is indirect: it requires reference-method results, and chemometric techniques relate the infrared spectrum to those reference measurements. The model therefore estimates a chemical value from a relationship established with known samples; it does not read concentration directly from an isolated spectrum.
Chemometric techniques can extract information from infrared spectra through multivariate analysis and help resolve complex spectral information. Preprocessing and variable selection can affect the accuracy and precision of infrared spectroscopy methods. Scattering, reflection, and interference may produce baseline changes, band distortion, and intensity changes in infrared spectra and can prevent direct interpretation based on the Beer–Lambert law.
In one downstream-processing study, FT-MIR quantified antibody aggregates down to 1% w/w in the study samples, monitored host cell protein levels down to 700 ng mL⁻¹, and determined antibody titer with high accuracy for samples above 0.7 g L⁻¹; host cell protein monitoring after intermediate and polishing chromatography was reported as currently not well suited. These figures describe that study’s materials and conditions, not a general performance threshold for every bioprocess.
A separate seized-sample study used IR spectroscopy with partial least squares regression to quantify cocaine and prominent adulterants and reported a validation R² of 0.946 for that model. The result belongs to the stated sample set, spectral range, and validation procedure; it should not be transferred to another matrix without application-specific evidence.
Before treating a quantitative output as usable, separate four questions:
- Which chemical variable is being estimated?
- Which reference method supplied the values used for calibration?
- Do the calibration samples cover the expected composition and concentration range?
- Has the model been tested on independent samples under the conditions where you will use it?
A clear answer to the first question does not substitute for answers to the other three.

Screen the sample and process before choosing an IR configuration
IR spectroscopy can be performed on solids, liquids, and solutions when they are sufficiently pure, but a solvent absorbing in the same region may mask sample information; solid samples can be crushed into fine powder for the best results. For a process stream, define the material and operating domain before selecting a configuration.
Your initial fit screen should record:
- The analytes or process variables that matter and the decision they must support.
- Expected concentration values, including the high and low extremes.
- Composition changes, water, solids, bubbles, multiple phases, and possible overlapping spectral features.
- Temperature, pressure, and the location where the sample will be measured.
- Whether the material reaches a bench setup, pilot side stream, recirculation loop, extractive system, or pressurized installation.
These details turn a general spectroscopy question into a defined measurement problem.
ATR measures infrared interaction at the contact surface and can analyze solid, liquid, and semi-solid samples without extensive preparation; its penetration depth is typically on the order of a few micrometres. Transmission requires the beam to pass through the sample, while reflection can be useful for solids that are difficult or impossible to analyze by transmission or ATR. Select the route that samples the part of the material relevant to your question.
Sample thickness, homogeneity, positioning, mixing, ATR contact, and water contamination can affect spectral quality and reproducibility. For quantitative analysis, concentrations should fall within the instrument’s calibration-curve range; extremely high or low concentrations may be inaccurate. If your sample changes across a Singapore laboratory, a North American or European production site, or a distributed operation in South America or Asia, document those changes rather than assuming that one sample presentation represents every location.
Build evidence that can support the intended chemistry decision
A quantitative measurement system should be evaluated as a complete path that includes the spectrum, calibration, reference method, sampling arrangement, installation, software, and lifecycle support. A detector and a plausible-looking spectrum are not the whole system if the result will guide quality control, process development, or a continuous-manufacturing decision.
Reference standards, known samples, specialized algorithms, and mathematical models can support calibration, validation, and compensation for instrumental drift and environmental variation. FTIR calibration can be affected by instrument drift, temperature and humidity changes, atmospheric CO₂, complex matrices, trace components, and inconsistent sample preparation. Reference-spectrum libraries can aid compound identification, but library comparison does not replace a quantitative calibration for a process estimate.
Validate a multivariate model with independent samples against predetermined performance criteria rather than judging it only on calibration data. Independent samples should represent the composition and operating conditions that matter to your intended decision, because a model can appear adequate within its calibration set while failing when the sample or process changes.
A change in measurement conditions or instrument can require model adjustment, additional evidence, or redevelopment. This boundary applies when a method moves between instruments, sampling locations, process stages, or installations. It also matters in classified areas and regulated sites, where the installation arrangement and qualification evidence belong in the project plan rather than being treated as afterthoughts.
Use a short evidence review before accepting a result for action:
- Name the decision and the acceptable performance criteria.
- Trace every estimated value to its reference method and calibration range.
- Check whether samples cover the expected matrix, temperature, pressure, and concentration changes.
- Test independent material, not only repeated calibration samples.
- Record what changes would trigger model review, adjustment, or redevelopment.
The review should make the boundary of the measurement visible to the people who will use it.
Separate spectral acquisition speed from the full evaluation timeline
We offer the OrionIR® mid-IR spectrometer, which provides one spectrum every second across 900–3500 cm⁻¹ through aqueous, strongly absorbing, and low-concentration streams. That is a stated acquisition capability for OrionIR®; the time required to produce a trustworthy process estimate still depends on the stream, reference data, calibration, sampling arrangement, and validation plan.
A practical evaluation timeline has several different stages:
- Application definition: specify the analytes, concentration extremes, composition changes, operating conditions, and required decision.
- Sample and sampling review: determine whether the sample path, geometry, and conditions can produce representative spectra.
- Reference and calibration work: collect the reference-method results needed to relate spectra to chemical values.
- Independent validation: test the model against predetermined criteria using independent samples.
- Deployment planning: account for installation, software, support, and any change in instrument or measurement conditions.
Our comparison page, published September 25, 2026, lists the PerkinElmer Spectrum Two FTIR spectrometer price between $30,000 and $45,000. That price example belongs to the equipment comparison, not to the duration of an application evaluation or the cost of a complete validated measurement system.
What determines the cost of an IR chemistry measurement system
The cost question should distinguish the base spectrometer from the complete measurement system. Instrument design, sample interface, accessories, process integration, calibration work, validation, installation, software, training, and lifecycle support can all become separate items in a quotation or project scope, so compare equivalent deliverables rather than comparing an instrument label alone.
Our comparison page, published September 25, 2026, lists these FTIR equipment examples:
- The Bruker ALPHA II is listed between $20,000 and $25,000.
- The Agilent Cary 630 is listed between $25,000 and $40,000.
- The PerkinElmer Spectrum Two is listed between $30,000 and $45,000.
- The Thermo Nicolet iS50 is listed between $35,000 and $50,000.
These are prices listed for named instruments on that page. They are not a universal price schedule for every configuration, application, region, or project scope.
A useful cost comparison asks each supplier to separate the parts of the measurement path: instrument, sampling arrangement, installation, software, reference method, calibration, validation, and lifecycle support. The complete-system view is especially important when your application involves a pressurized stream, continuous manufacturing, changing feedstock, or a regulated pharmaceutical environment.
Before requesting a price, prepare the information that changes the scope:
- Sample or stream composition, phases, solids, bubbles, and water content.
- Target variables and concentration range.
- Temperature, pressure, sampling location, and required measurement frequency.
- Whether the work is laboratory, at-line, pilot, recirculating, or installed in a process.
- Reference-method availability, calibration expectations, validation criteria, and support needs.
A lower equipment price is not directly comparable with a higher price if the two proposals cover different measurement paths or evidence requirements.
When unresolved fit questions require professional evaluation
Application-specific evaluation becomes necessary when the sample may not be representative, the operating conditions are not represented in the test material, or the intended result is more consequential than a qualitative screen. The same boundary applies when concentration extremes may fall outside the calibration range, when solids or multiple phases change the measurement, or when the sample cannot make consistent contact with the selected sampling interface.
You should pause an instrument comparison and resolve the measurement path when any of these conditions remains unclear:
- The analyte, concentration range, or required decision has not been defined.
- Temperature, pressure, water, solids, bubbles, or composition changes are not represented in the test material.
- The sample location or geometry may not represent the process stream.
- No suitable reference method is available for quantitative calibration.
- Validation has relied only on calibration samples.
- A proposed instrument or installation differs from the conditions used to develop the model.
The direct next step is to assemble representative samples, operating conditions, the intended decision, and the current reference method for a focused technical assessment. If those inputs show that the measurement path is not yet defined, resolve the sampling and evidence questions before selecting a model or treating a spectral output as a process value.
Interpret absorption bands before assigning chemical meaning
An IR spectrum is a record of how a sample interacted with infrared light, and its bands provide chemical information through their position, shape, and intensity. A focused brief should name the chemistry, sample or stream, operating conditions, target variables, concentration range, sampling location, intended decision, reference method, and remaining uncertainties. A qualified professional should decide individual suitability and the evidence required for your application.
Use the brief to separate what you already know from what must be tested. Include whether the work is laboratory, at-line, continuous, or installed; whether the site is in Singapore or part of an operation across North America, South America, Europe, or Asia; and whether classified-area or regulated-site conditions affect the installation and validation plan.
What should you clarify before asking about IR machine chemistry?
Is infrared spectroscopy suitable for every chemical sample?
No. Suitability depends on infrared activity, composition, concentration range, water or solvent absorption, solids, bubbles, temperature, pressure, homogeneity, and the sampling geometry. Symmetric homonuclear molecules such as O₂ and N₂ do not appear in IR analysis because their vibrations produce no net dipole change. A feasibility assessment should test representative samples under the conditions where the measurement will be used.
What information should be prepared before evaluating an IR chemistry application?
Define the analytes or process variables, expected concentration extremes, composition changes, water, solids, bubbles, temperature, pressure, sampling location, and the decision the result must support. Also identify the reference method, measurement geometry, required frequency, and validation criteria. These details determine whether a spectrum can become a useful qualitative observation or a defensible quantitative estimate.
How long does IR machine chemistry usually take?
Recording a spectrum can be rapid; for example, OrionIR® is described as providing one spectrum every second across 900–3500 cm⁻¹. That acquisition time is not the duration of a complete application. Defining the process, selecting the sampling arrangement, collecting reference data, developing calibration, validating independent samples, and planning deployment can take longer and varies with the application. A project-specific estimate should assign time to application definition, selecting the sampling arrangement, collecting reference data, developing calibration, validating independent samples, and planning deployment; base it on the samples, available reference data, validation criteria, and installation scope.